
Note
Go to the end to download the full example code or to run this example in your browser via Binder
Ellipsoid#
A simple reference object for testing, demonstrations or debugging.
The ellipsoid is generated by the function dbdicom.dro.ellipsoid() which has the same arguments as the skimage.draw.ellipsoid function from which it is derived.
# Choose this image as a thumbnail for the gallery
# sphinx_gallery_thumbnail_number = 1

from dbdicom import dro

# Define the half-width dimensions of the ellipsoid in mm
width = (
    12, # x half width (mm)
    20, # y half width (mm)
    32, # z half width (mm)
)

# Define the spacing between points (same units)
spacing = (
    2, # x spacing (mm)
    3, # y spacing (mm)
    1, # z spacing (mm)
)

# Generate the ellipsoid as a DICOM series
ellipsoid = dro.ellipsoid(width[0], width[1], width[2], spacing=spacing, levelset=True)
The function returns a dbdicom.Series object ellipsoid which retains not only the array but also other important information about the volume. Some examples:
# Extract the numpy array in 3 dimensions (columns, row, slice):
print('Shape of the ellipsoid array:')
print(ellipsoid.pixel_values().shape)

# Extract the 4x4 affine array as a nympy ndarray:
print('\nAffine of the ellipsoid:')
print(ellipsoid.affine())

# Extract the value for any standard DICOM header element using its keyword
print('\nSome typical DICOM header information:')
print('-> Patient name: ', ellipsoid.PatientName)
print('-> Study date: ', ellipsoid.StudyDate)
print('-> Series description: ', ellipsoid.SeriesDescription)
print('-> Slice location: ', ellipsoid.SliceLocation)
Shape of the ellipsoid array:
(15, 15, 67)

Affine of the ellipsoid:
[[3. 0. 0. 0.]
 [0. 2. 0. 0.]
 [0. 0. 1. 0.]
 [0. 0. 0. 1.]]

Some typical DICOM header information:
-> Patient name:  Ellipsoid
-> Study date:  None
-> Series description:  Levelset ellipsoid
-> Slice location:  [0.0, 1.0, 2.0, 3.0, 4.0, 5.0, 6.0, 7.0, 8.0, 9.0, 10.0, 11.0, 12.0, 13.0, 14.0, 15.0, 16.0, 17.0, 18.0, 19.0, 20.0, 21.0, 22.0, 23.0, 24.0, 25.0, 26.0, 27.0, 28.0, 29.0, 30.0, 31.0, 32.0, 33.0, 34.0, 35.0, 36.0, 37.0, 38.0, 39.0, 40.0, 41.0, 42.0, 43.0, 44.0, 45.0, 46.0, 47.0, 48.0, 49.0, 50.0, 51.0, 52.0, 53.0, 54.0, 55.0, 56.0, 57.0, 58.0, 59.0, 60.0, 61.0, 62.0, 63.0, 64.0, 65.0, 66.0]
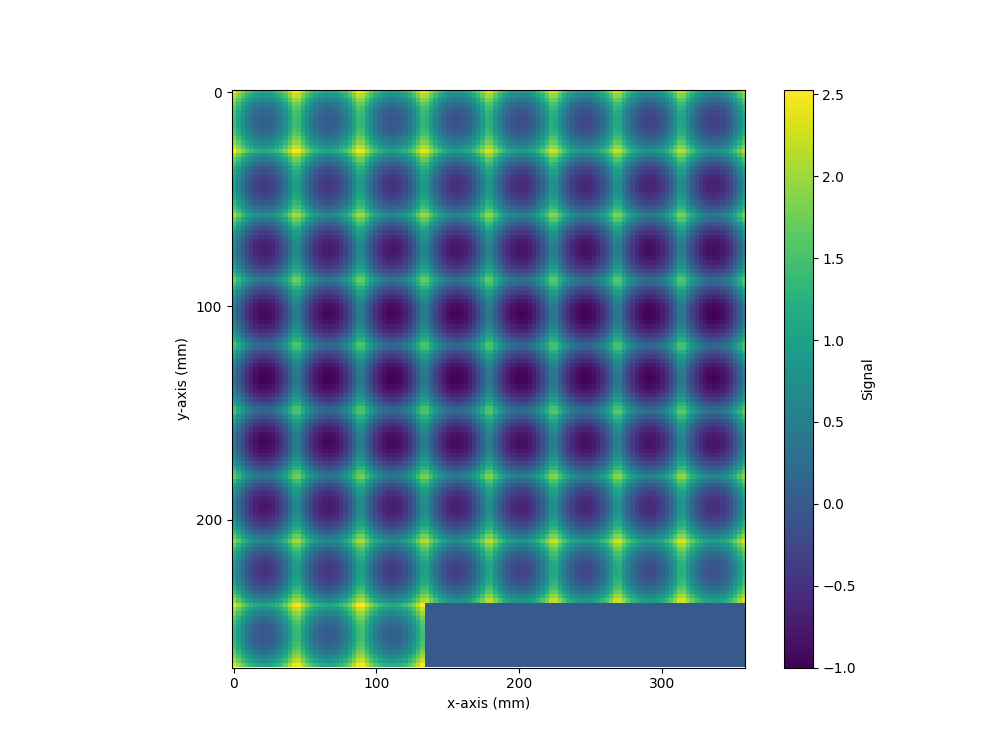
Since the ellipsoid was generated using levelset=True, the array represents a range of levels, as can be seen by displaying the array as a mosaic using the plot_mosaic() function from the matplotlib extension:
from dbdicom.extensions.matplotlib import plot_mosaic

plot_mosaic(ellipsoid)
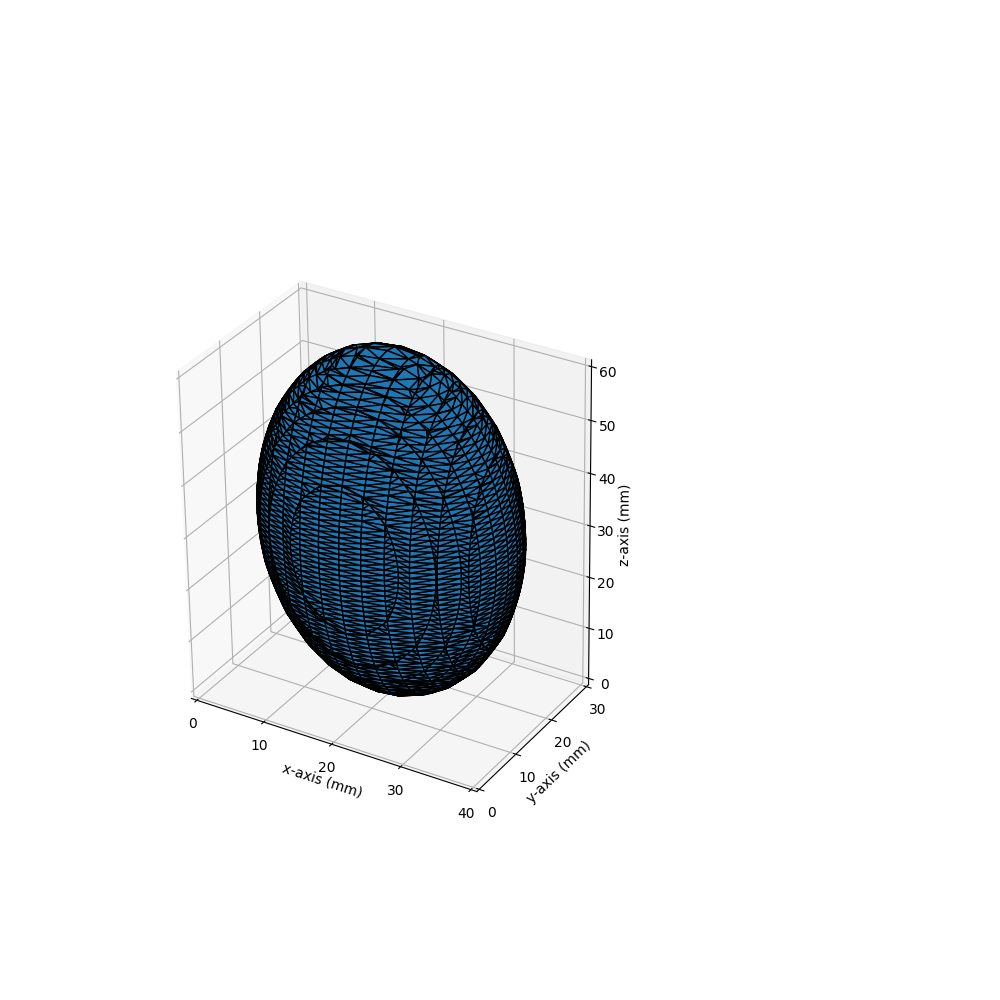
The triangulated surface of the ellipsoid can be visualised using the plot_surface() function from the dbdicom extension matplotlib. This displays the surface as a triangulated mesh, using the voxel spacing to ensure proper scaling of axes in the 3D plot:
from dbdicom.extensions.matplotlib import plot_surface

plot_surface(ellipsoid)
Total running time of the script: ( 0 minutes 4.874 seconds)